


27 Jun Market Situation, Part II
Last week I provided an insight into how high the market currently is when using the so-called “Buffet Yardstick”. Later on, I showed how much part of those valuations is fuelled by purchases on margin, adding even more risk to the market. That’s why risk aversion seems to be at one of its lowest levels in decades.
This week I want to include another popular multiple, but with a slight twist on it, which in my opinion helps to provide a better perspective. Despite the variety of nuances relative or price valuations carry, these are much less time consuming than discounted cash flow valuations, which rely on a long list of explicit and uncertain assumptions. Moreover, the objective of using this type of valuation is to price an asset or investment based on how much investors are paying for similar ones. While value is driven primarily by fundamentals, price is set by demand and supply. Therefore, this type of valuation will save us time and observe the current mood of the market.
One of the most intuitive ways to value a company is as a multiple of the earnings that company generates, or in more technical terms, the Price to Earnings ratio. This PE ratio is the market price at which a share of the company is trading divided by the current earnings per share. Therefore, when under the same earnings people rush up to buy the stock, the price term on the numerator will increase due to higher demand, and the PE ratio will rise. Conversely, when the market isn’t very enthusiastic about the company and keeps its price low, the PE will be low as well. Thus, it is more intelligent to acquire shares when they are trading at low PE ratios, as they will be more likely undervalued and have a higher expected return. In certain instances, like when a company has negative earnings, the multiple can’t be computed or will lose its significance. In order to include those businesses in our sample, we will use a multiple that can be computed and compared among all firms, including those losing money. That is the inverse of the PE ratio: the earnings yield. There is, however, one more twist still to be made. Because this ratio uses market price and earnings per share, all debt is excluded. In order to do add it in, we will include them in both the numerator and the denominator. As a result, we end up with the ratio EBITDA to Enterprise Value.
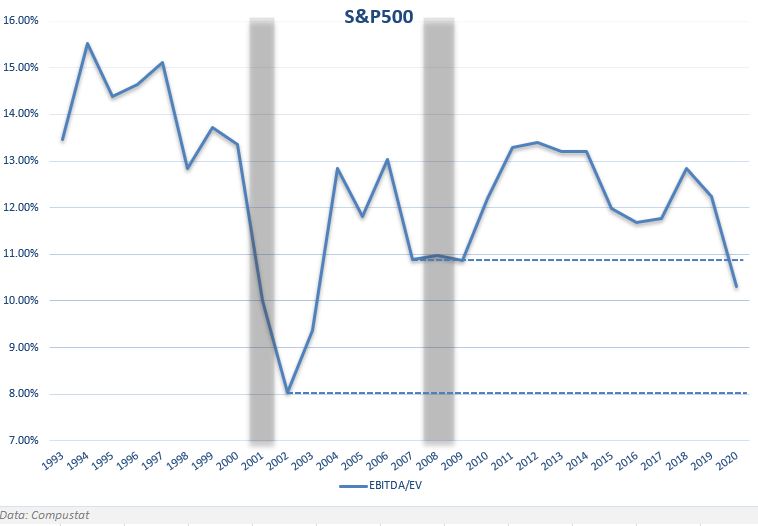
If we look back almost three decades, we can see in the chart how this ratio has fluctuated in the S&P500. In general terms, we will always want to buy cheap; that is, when the percentage is higher. That is normally what happens after a recession, when there is not much optimism in the market and people are just too scared to invest. On the contrary, during bull markets, this percentage tends to be lower. There is a lot of hype in the market, people are excited and overly optimistic, and as a result, stocks become overvalued. Until very recently, even after a world-wide pandemic, lockdowns, reduced consumption, labor shortages, and uncertainty conditions, markets haven’t reduced their optimism about the economy. Although not as much as during the tech bubble, they now seem eager to pay higher valuations than during the Global Financial Crisis.
The over-optimism mentioned before doesn’t apply only to retail and institutional investors. Businesses are a fundamental part of the financial markets, and because they are run by people, they fall under the same influence as well. During boom periods, increasing positive returns create greed among managers. They mistake value creation with growth, and in order to pursue the latter, they start acquiring debt. But there is just so much debt you can have. When the bust finally arrives, the business contemplates a severe revenue shortfall. The worsening conditions compound when debt is high, and the delivery of interest payments and principal becomes harder to make. At this time, many of the managers who embraced higher leverage situations see the risky effects of using large amounts of debt and start reversing the process, known as deleveraging. Eventually, those companies that survive see an overall reduction of debt on their balance sheets… Then, after a few years, managers forget about what happened–a very common Wall Street and Main Street symptom–and the process starts all over again. But what is the situation now?
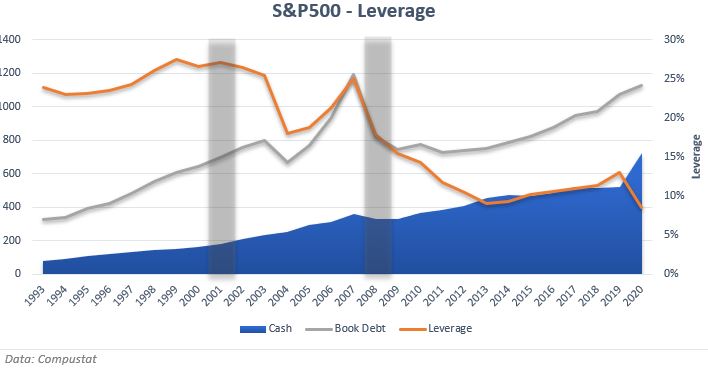
Notwithstanding seeing an increasing amount of short- and long-term debt on their balance sheets, these companies have also been hoarding cash at levels never seeing before. The leverage here comprises net debt divided by total assets. Only four years after the second worst recession in history, the short-term memory symptom showed up again, and leverage slowly but steadily went up. The pandemic slightly reversed the trend again, but we know what we can expect moving forward. Nevertheless, we are on a much lower level than during both previous recessions, at least for the largest stocks in the market.