


13 Jun Margins squeezed, a bad omen
Margins are a fundamental component of any company, and should be carefully considered by business owners, managers and investors alike. There are as many margins as types of profits out there: gross, operating, pre-tax, and net. Very simplified, it works like this: a random company sells products and receives cash in exchange. This amount of cash inflow from sales sits at the top of the income statement as revenue. But in order to sell, the company needed to either buy the product beforehand or purchase raw material prior to transforming it into the final product sold. When we subtract this first direct cost, we get the gross margin. Then it needs to pay more operating costs, such as wages, rent, advertising and research; what’s remaining is the operating margin. The firm may also need to pay any interest on the debt it has, which leaves a pre-tax margin. And finally, a portion of those profits must be shared with the government as taxes, resulting in bottom line net margin. Each type lies at a certain level within the income statement and carries very high significance in its result. For instance, a firm with a wide gross margin but a very low operating margin may signal that is spending too much in advertising. Another firm with an excellent gross margin, a substantial operating margin but a very low net margin can indicate it is paying a lot in debt interest or be carrying a substantial block of debt in its balance sheet.
Different industries carry different historic margins. Luxury or technology items will generally have higher margins than consumer staples. Incumbents, when reading a company financial statement, look at the historic margins and try to predict, with help from the Annual Report and any reliable sources, if they will get broader or narrower in the next years. Although a small percentage change may seem negligible, this effect has an enormous impact on valuation. Let’s illustrate with one example. You are an analyst and want to determine the value of a random firm that has 1 billion in revenue and a 3% after tax operating margin. Using a discounted cash flow (DCF) method—the most popular one—and different inputs to solve the formula, you get a company value of $390 million. However, you just saw that the new management recently hired by the company has an excellent reputation, and you believe that, alongside other positive information you gathered elsewhere, they can improve operations and broaden margins. Based on this optimistic scenario you reckon margins can increase up to 5% in the next years. Using the same data inputs as previously but just updating the operating margin, you run the formula again and come up with a new value of… $650 million! That’s 67% more than before!
As you see, margins are one of the major value drivers. You can use this information to your advantage when improving conditions are realistic and it exists a reasonable amount of certainty. Intelligent investors are well aware of this. This was a crucial part of Warren Buffett’s strategy when he invested in Coca-Cola between summer 1988 and spring 1989. It was his largest investment to date, reaching an approximately 7% company ownership and one third of the Berkshire portfolio. During the 1970s, despite its still respectable financial results, Coca-Cola was fragmented and marred with disputes, accusations and internal issues. To exacerbate corporate woes, Paul Austin, its CEO at the time, had been running it erratically, driving margins down with his management decisions and new diversifications in different type of businesses with low margins—for instance, a shrimp farm and a winery. When the board replaced him in 1980 with Goizueta, the first foreign chief executive officer, the mission statement became crystal clear: maximize shareholder value over time. He cut costs, divested and sold any non-core units and focused on the high-return soft drink business, that had very high historic margins. In 1908, Coca-Cola’s pretax profit margins were 12.9 percent; by 1988, margins had climbed to a record 19 percent. The results didn’t take long to be reflected on the stock market. The market value in 1980 was $4.1 billion; by 1988, even after the famous October crash of 1987, the value had surged to over $14.1 billion. Buffett started buying after that vast improvement and still was one of the best investments he ever made. Goizueta kept fighting those margins, focused on the core business, initiated at the company the first ever buy-back program and took many other smart management decisions. Ten years after he began investing, the market value of the company had grown to $143 billion. What makes margins so interesting are not only how they directly affect the valuation of a firm but also the amount of cash that frees up, and that can be reinvested into its very profitable business.
From a macro perspective, corporate margins fluctuate over time, along with the business cycle. At the end of a period of contraction and the beginning of a period of expansion, economic confidence builds up, what increases consumer demand. This produces sales growth and an increase in business activity. More staff is needed, what creates employment. As a result, there is a fresh rise in consumer demand, creating a domino effect, and so on and so forth. Many companies are able to escalate operations and become more efficient; they basically can sell more without investing so much capital in new personnel or advertising. At some point, this process slows down. The Federal Reserve raises interest rates to cool down the overheated economy, low unemployment raises wages, rents go up by increasing demand, new firms pop up in the most profitable industries to take a portion of the cake, and inflationary pressures build. All these different factors generate a negative effect on margins, squeezing them, and signalling a worsening of the business conditions. As the situation continues, firms don’t have any other choice but to cut costs, fire people, spend less on advertising, etc. And it is at this point that the economic contraction starts back again.
In the U.S., labour shortage–workers are quitting their jobs at the highest level in the last two decades–is holding back growth for many businesses. This is especially true for the small ones, those that actually provide more opportunities in the job market. In the meantime, they must pay higher wages to attract the little human capital willing to work. Moreover, strong conversations are taking place to replace the federal minimum wage with $20/h. Rent keeps increasing, what caps spending for many firms and households alike, and the central bank is very determined to push up inflation. The upcoming conditions don’t look promising for corporate margins, and we have already seen the result of that when looking back in time.
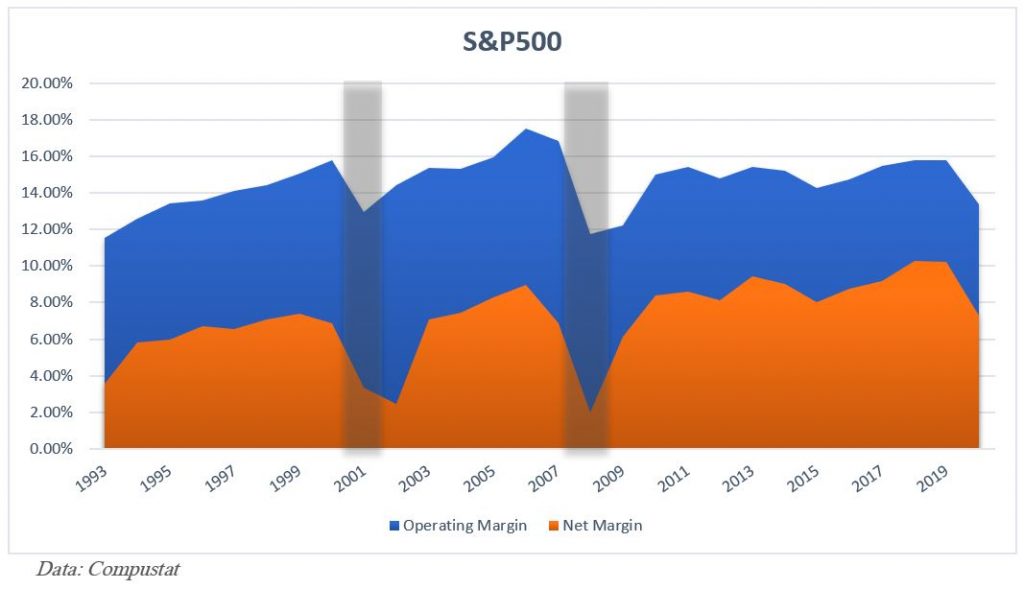
This chart represents the operating and net margins of the S&P500. The shaded areas are the two previous recessions. As we see, margins were already suffering before the economic contraction started. And this index comprises the biggest firms out there. Smaller businesses usually suffer such squeezes much more often… and substantially. Before the pandemic, net margins were at its highest level in history, and they were already high before, which should be considered a strong sign of caution. Sure, over the last two decades new technologies have allowed these margins to increase to levels not attainable before. But such a situation is never sustainable. We could clearly add this to our—already large—list of factors that may trigger the next recession. We should act in consequence and protect our capital before the largest bull market in history decides to take a breath.