


08 Ene The EV Delusion
“I can calculate the motion of heavenly bodies, but not the madness of men.”
– Isaac Newton
This opening sentence is perhaps the most famous quote attributed to a bubble ever heard. It took place during one of the first and best-documented examples of irrational investors’ behaviour, The South See Bubble of 1720. Unsound judgement of those who could invest and the subsequent crash led the frustrated Newton to lose a substantial amount of money and to leave this ever-present quote for the record. Three centuries later, and after several business cycles, we find ourselves in a remarkably similar situation, particularly to the Dot-com era. And why is that?
Electric vehicle (EV) companies have gone sky-high, despite showing not only low or negative earnings, but in many cases… no revenues at all! In some instances, we can attribute to investment funds the art of selling incomprehensible financial products or stocks to their clients. But this time, this sort of exciting and appealing technology easily sells itself. It isn’t something new. Each era has its own group of stocks that people flock to. Many historical bubbles have been connected with the dawn of new technologies: from the great railway mania in 1845, to bicycles in the 1890s, to automobile and radio stocks in the 1920s, and to the dot-com craze of the late 1990s. In each of these moments, despite being the source of the excitement quite different, euphoric investors became convinced that traditional valuation rules did not apply to these new-age companies. Their resulting speculative behaviour was practically the same. During the boom of the internet, these new companies did not need to reveal any revenue or earnings growth for equity funding. It was enough to add a dot and a com to its name, provide an exciting business concept, and go public, to push the share price upward. Today, at the beginning of 2022, many of these companies, and many through a SPAC, have achieved the exact same outcome. I have gathered a list of what I consider the most important industry EV companies worldwide. The table does not contain traditional automakers that are developing their EV models in-house.
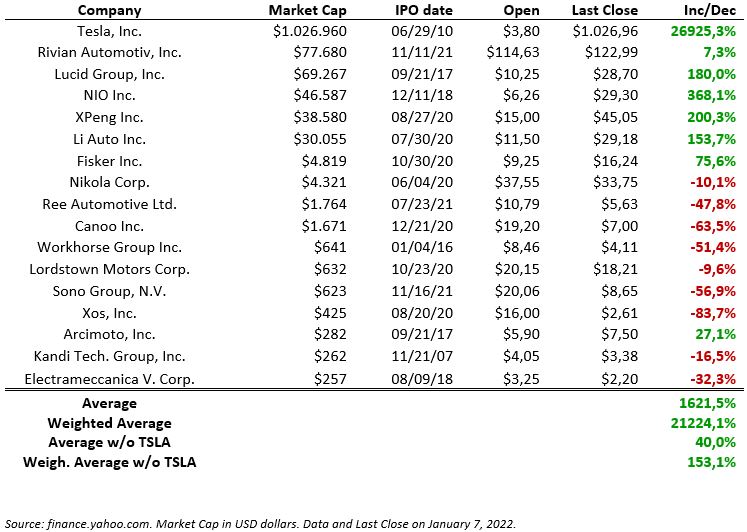
As observed, the disproportionate return of Tesla distorts the average returns of the aggregated list. If we do not include it, average returns would still be high, especially if we had created a portfolio with a capital allocation correlated to their market capitalizations. Moreover, all companies, except Kandi Tech., are fairly new in the public markets, so we could have achieved these returns in a very short amount of time. Interestingly enough, the largest companies clearly reveal a better stock performance.
In past decades, if you wanted to invest in one of those disruptive companies that were going to revolutionize the world, you needed to physically talk to the liaison at your bank or your broker–or later on on the phone–and arrange the purchase and sale of the stocks, if you did not already trust them to do what they pleased with your money. Now, a retail investor, from a comfortable sofa, can download to its phone any of the many available online brokers, open an account within a matter of hours, and quickly invest in any stock they see fit. Frictions are lower than ever, and these so-called investors can act–and many do act; otherwise, why those large valuations?–impulsively without even considering the actual intrinsic value of these businesses. Those who forget history are doomed to repeat it. Does it make sense to invest in a car manufacturing company–or any company, for that matter–at these prices that already reflect years of earnings growth without having proved any earning power at all?
Now, to have a closer look at where stands the current valuation ratios of the EV stocks, we can have a look at the table below. We will use the price-to-earnings (PE) ratio and the enterprise value-to-sales (EVS) to quickly have an idea of how expensive or cheap a company is related to its earnings. It is also used for comparison among businesses. When the PE ratio, or the fraction price divided by earnings, is low, it means that either the numerator is low, or the denominator is high, which is good because the price of the stock compared to what it earns is favorable. And vice versa, when the ratio is high, the relation to its earnings is not so good, and the expected return on that stock is lower. Warren Buffet–who gathered a large part of his wisdom from his mentor, Benjamin Graham–likes this ratio below 15. So, what do we see here?
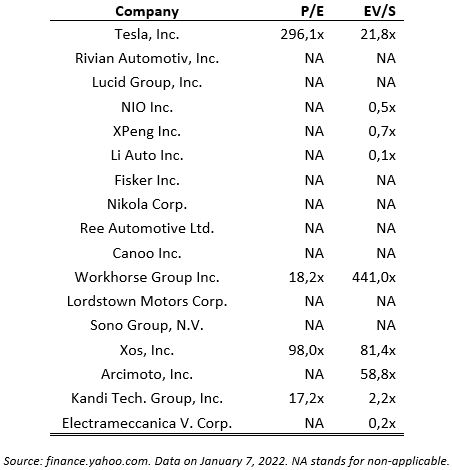
What we see correlates to a great measure to what happened during the internet era. In most cases, earnings are either zero or negative, so we can’t even rate the stocks using the PE ratio because there is no “e” in the fraction. The business model has not been proved profitable yet. A financial analyst will have to move further up in the income statement to find a positive number. So, we can try now and look at the next column which contains another ratio, the enterprise value-to-sales. This is used in early-stage and high-growth companies, often operating at a loss. One of the big supporters of this method is Kenneth L. Fisher, who wrote about it in his best seller book Super Stocks. His rules are: avoid stocks with a ratio greater than 1.5, and never buy those in excess of 3; aggressively look for stocks with a ratio of 0.75 or less; once you buy a stock with a desirable EVS ratio, sell it when it reaches 3 or even higher if you are really a risk taker. The results from the table speak for themselves. Those non applicable ratios belong to companies that clearly trade based on hype. As a reference, and to have a general idea of the situation of the stocks in the S&P500 index, the enterprise value-to-sales ratio hit in December 2021 its historic high at 3.15. If the overall market is currently considered expensive, what do we say about these EV stocks?
Additionally, to gather another idea of the current general market valuation, we can also check the cyclically adjusted price-to-earnings ratio, or commonly knowns as the Shiller CAPE ratio. It’s a valuation measure applied to the S&P 500 equity market, and it is defined as price divided by the average of ten years of earnings, adjusted for inflation. During the Dot-com era, it reached the 45 level, the highest value ever recorded. This month, it roughly reached 40, the second highest ever. The third position stands at 33. And guess what, it was on the eve of the 1929 Crash, before the Great Depression.
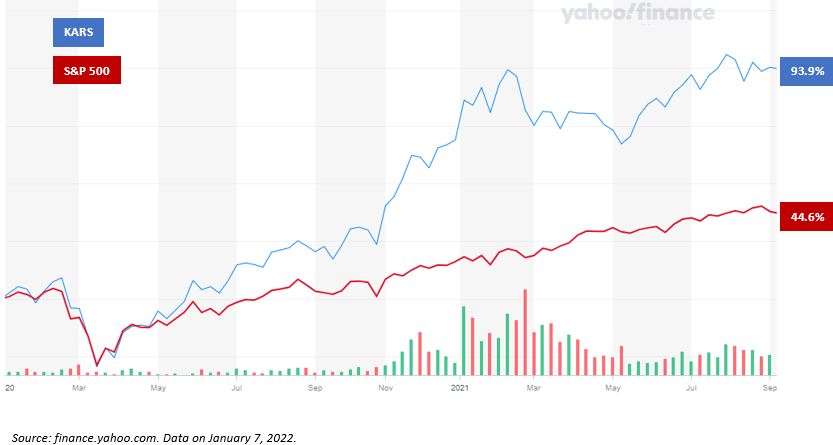
The performance of this new sector is also represented by the KraneShares Electric Vehicles and Future Mobility ETF (KARS). It provides exposure to companies engaged in the production of electric vehicles and/or their components. From its inception in January 2018, KARS is up 83.6%, while the S&P500 is up 63.46%. However, most of this over-performance has occurred in the last two years. Despite the recent index correction that started in this past November, since January 2020, KARS has increased a 93.9%, while the S&P500 a “shy” 44.6%. A 49.3% spread of performance in just two years.
The consequences of following this ongoing delusion can be catastrophic for investors. Those investors who do not want to stick to traditional valuation measures are bound to suffer large losses at some point in the future. Discipline when using your long-term old-fashion strategy is fundamental. Mark Hulbert, from the well-respected Hulbert Financial Digest, who is being tracking the real-world performance of investments advisory newsletters since 1980, once said: “It is not the strategy itself that makes the difference. It is the discipline, especially when one is out of sync with the market.”
We clearly run out of options to use any comparable ratios for these businesses. Since when is it possible to run a DCF model with no financial results? It seems just storytelling and promises must suffice. Perhaps we need to make up a new valuation metric– “Most exciting narrative”? “Greatest earnings promise”?